

Market Commentary
AI: the bond market is starting to push back
·
Market Commentary
·
François Campeau, CFA

As you know, we believe AI stocks are in a speculative bubble.
That said, it is hard to know when this bubble will burst.
For us, the best leading indicator comes from the bond market, not the stock market. Lenders are usually the first to react when excesses build up. It makes sense: all a lender can ever get back is the money it lent, plus interest. It does not share in the company's upside.
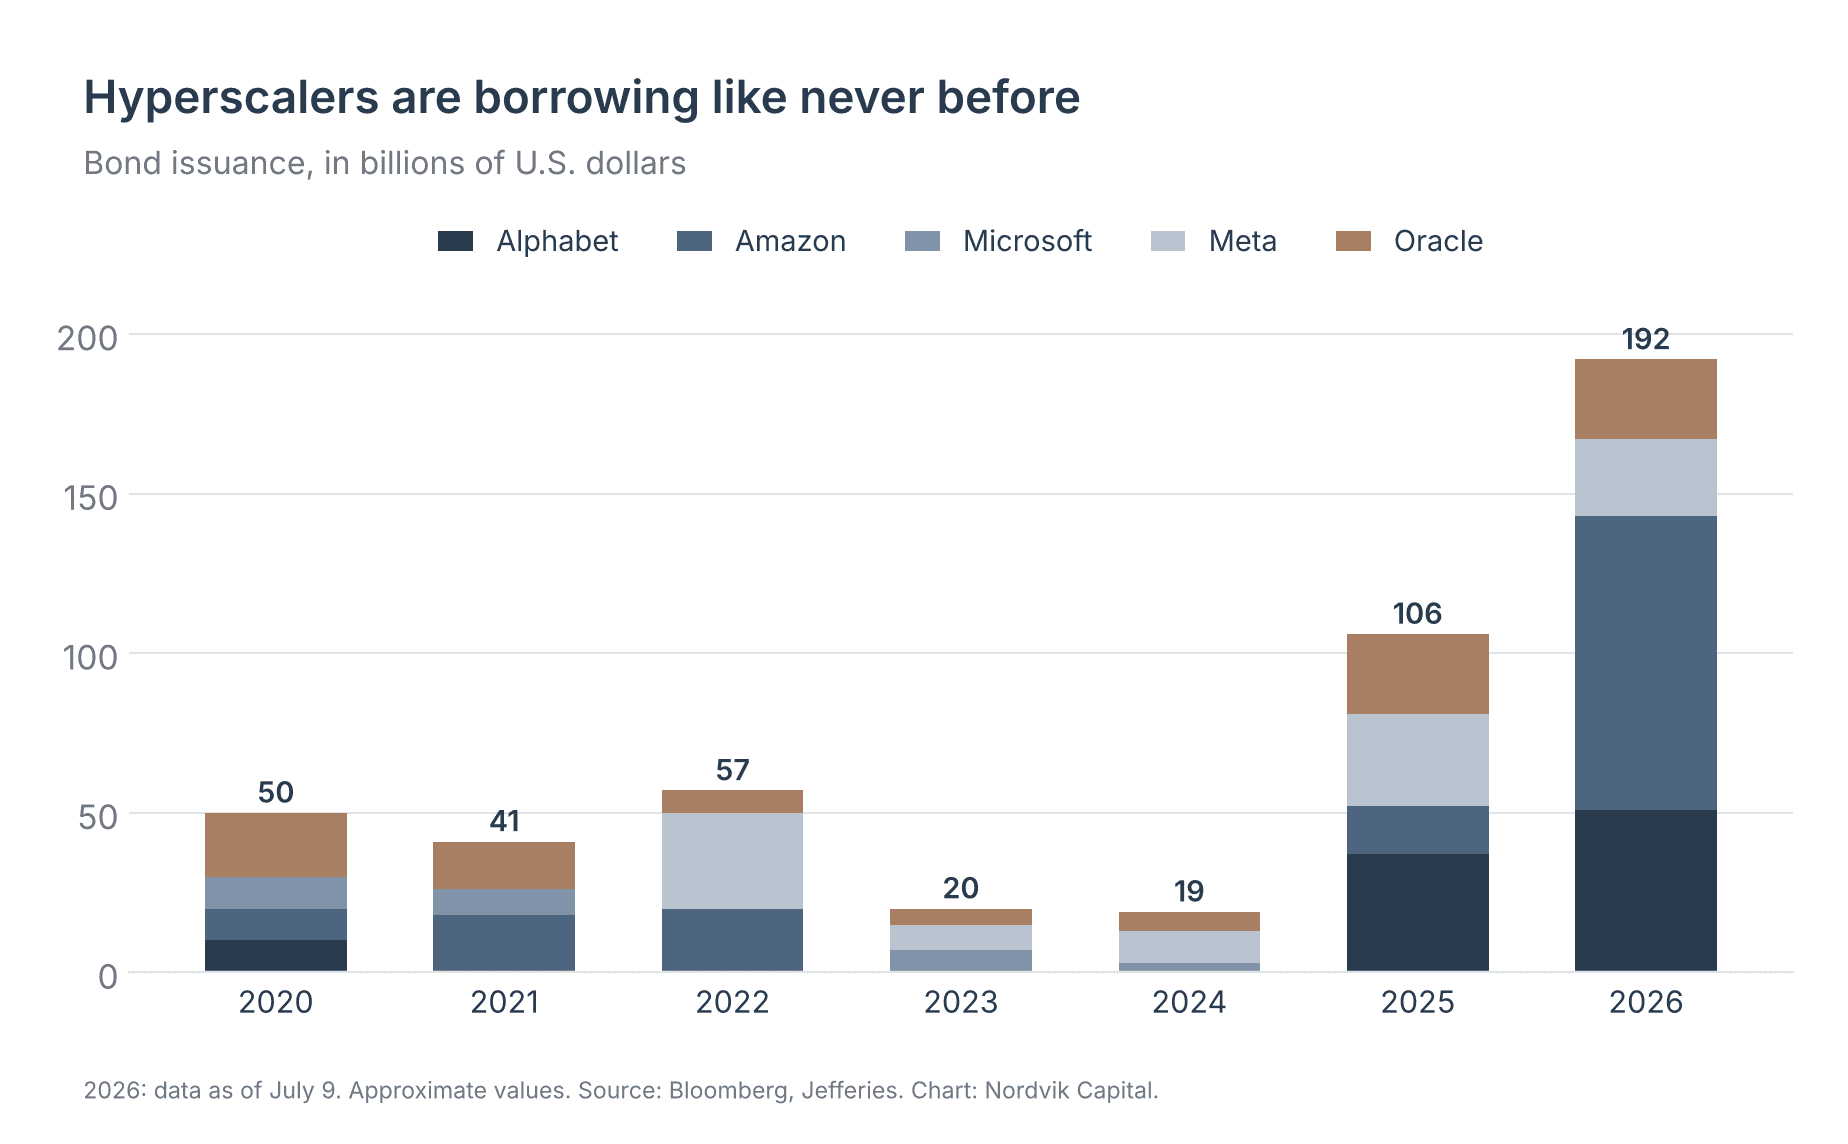
The big companies paying for AI, such as Alphabet, Microsoft, Amazon and Meta (the “hyperscalers”), have strong balance sheets, but those balance sheets have been deteriorating for some time. The chart below shows their bond issuance over the past few years.
On top of that, the Japanese financial daily Nikkei recently published an analysis showing that the hyperscalers carry more than $1.6 trillion in commitments that do not appear on their balance sheets¹.

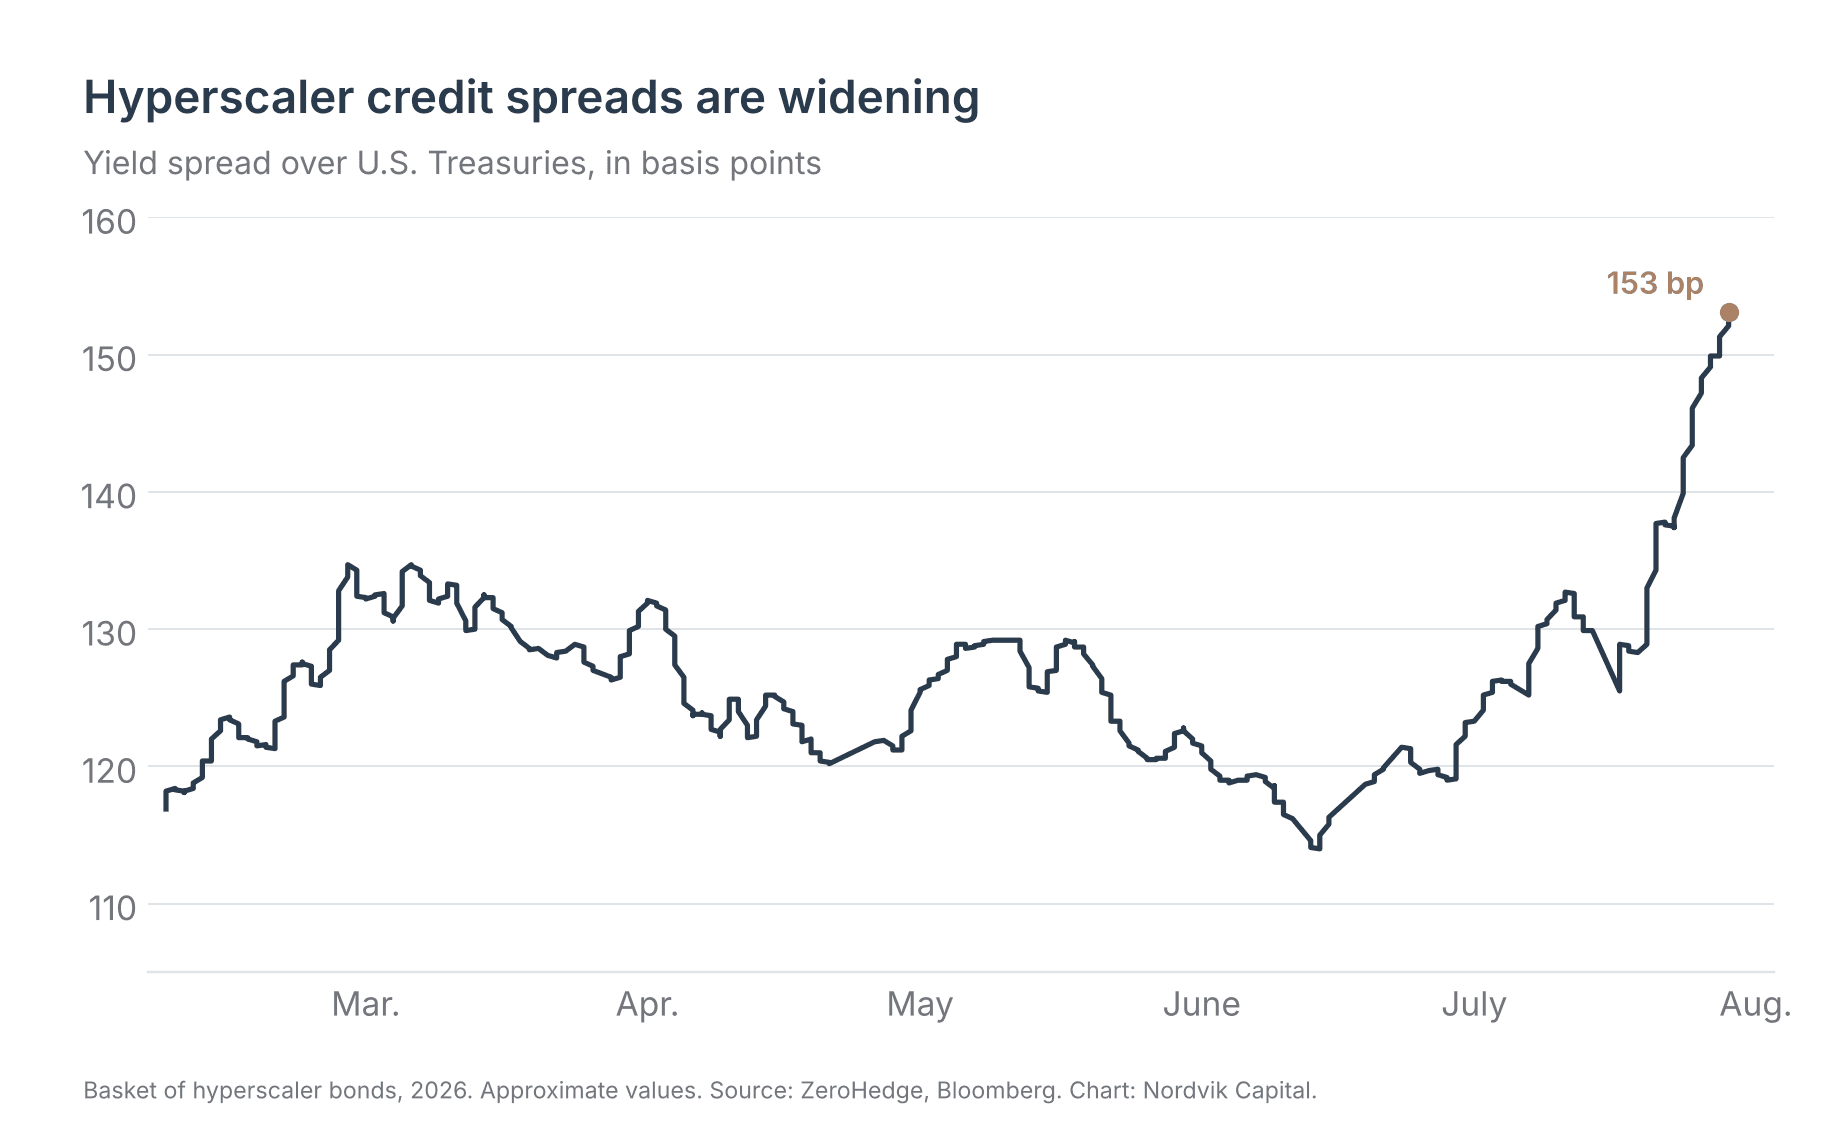
This surge in the supply of debt means lenders are demanding a higher rate to part with their money.
The credit spread is the borrowing rate above that of U.S. government bonds. As the chart below shows, it has moved from about 1.25% to more than 1.5%.
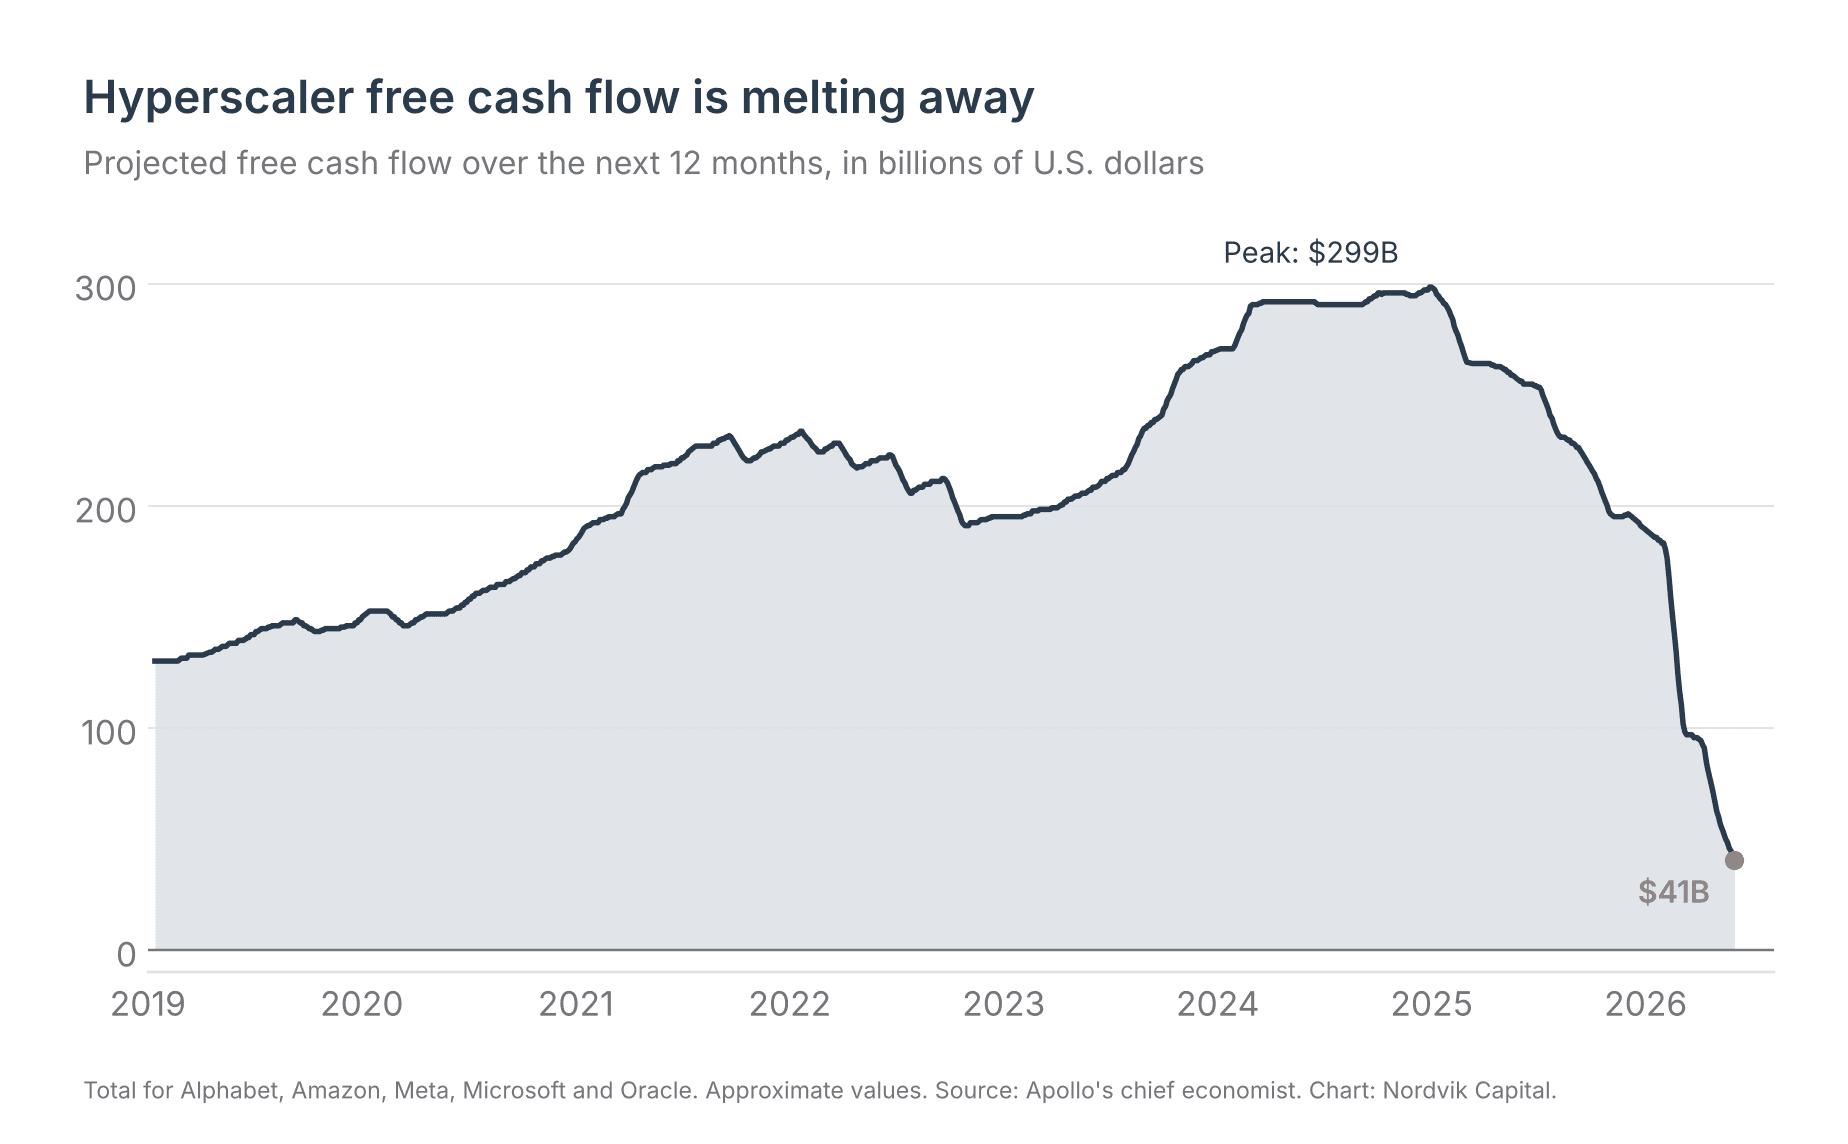
The main reason for this increase is that the hyperscalers' cash flows are shrinking. Alphabet reported its results last week, and the stock fell after the company announced negative free cash flow of more than $5 billion in the latest quarter, a first since it went public².
But the company in the most difficult position is probably Oracle, Larry Ellison's firm, generally regarded as the fifth hyperscaler. It carries roughly $130 billion in debt and is expected to burn about $30 billion in cash flow next year³.
The bond market now demands 8% to lend to Oracle over the long term. It is hard to earn a good return on your investments when you are borrowing at 8%.

There is also a financial instrument called a credit default swap (CDS). It is the annual cost of insuring against a borrower's default. The chart below shows Oracle's CDS since 2009.
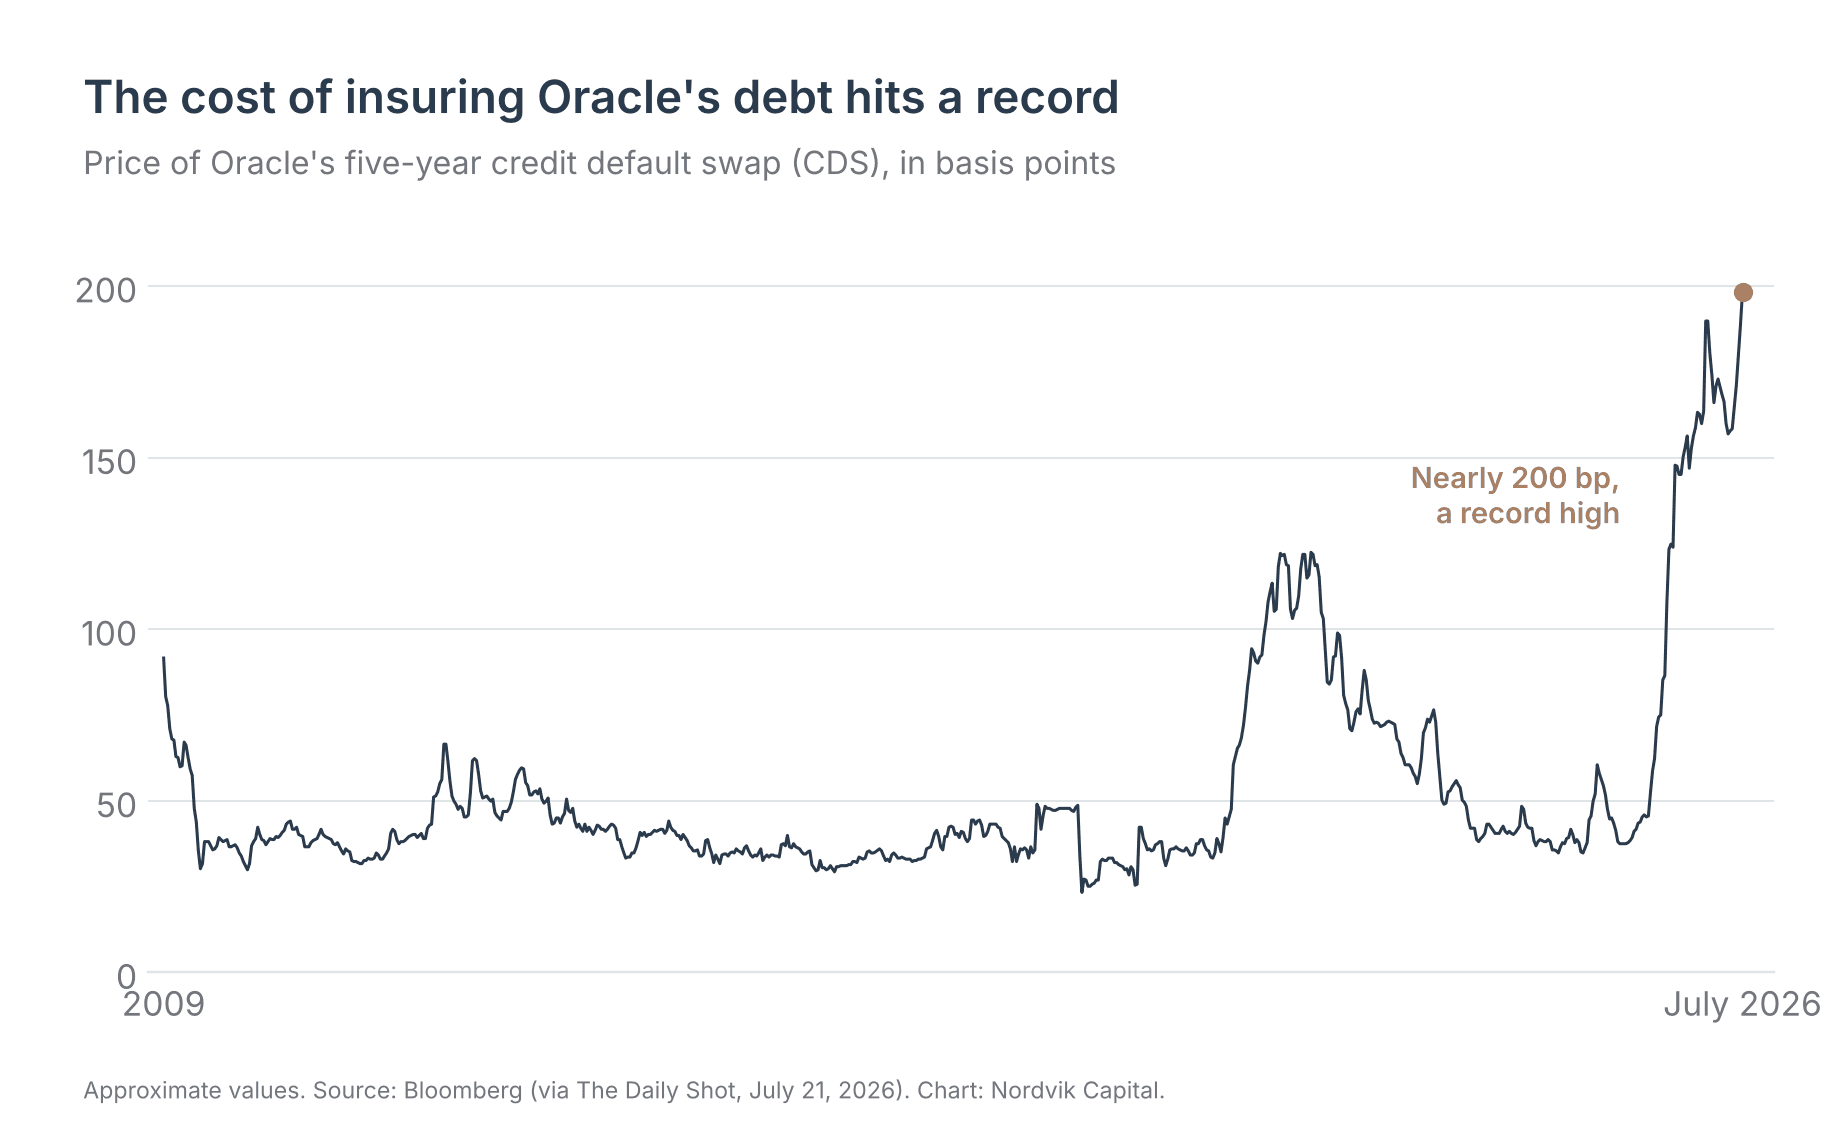
The bond market is starting to push back.
It is hard to know when the music will stop, but the bond market is telling us it could be sooner rather than later.
François
Notes and sources
¹ Nikkei analysis published in July 2026: $1.65 trillion in off-balance-sheet commitments for Alphabet, Amazon, Meta, Microsoft and Oracle. See AI2 Work.
² Results published July 23, 2026; first negative free cash flow in 22 years as a public company: Semafor. Capital expenditures of $44.9 billion against operating cash flow of $39.1 billion, for free cash flow of about −$5.9 billion: Tom's Hardware, Semafor.
³ Debt of about $130 billion at the end of May 2026 and free cash flow of −$24 billion for fiscal 2026: Startup Amsterdam. Consensus analyst estimates call for free cash flow of about −$28 billion in fiscal 2027: TIKR, cited by Yahoo Finance (March 2026).
Charts: Bloomberg and Jefferies (issuance); Nikkei (off-balance-sheet commitments); ZeroHedge and Bloomberg (credit spread); Apollo's chief economist (cash flows); market data (Oracle yield); Bloomberg (Oracle CDS). Values read from the original charts; all charts were produced by Nordvik Capital.
This publication reflects Nordvik Capital’s views as of the date of publication. It is provided for informational purposes only and does not constitute personalized financial, tax, or legal advice, nor is it a recommendation to buy or sell any security. Past performance is no guarantee of future returns.
RELATED READING
·
Market Commentary
·
Market Commentary
