

Market Commentary
AI and the year 2000: a sense of déjà vu
·
Market Commentary
·
François Campeau, CFA

Financial markets appear to be in a speculative bubble built around artificial intelligence (AI) stocks.
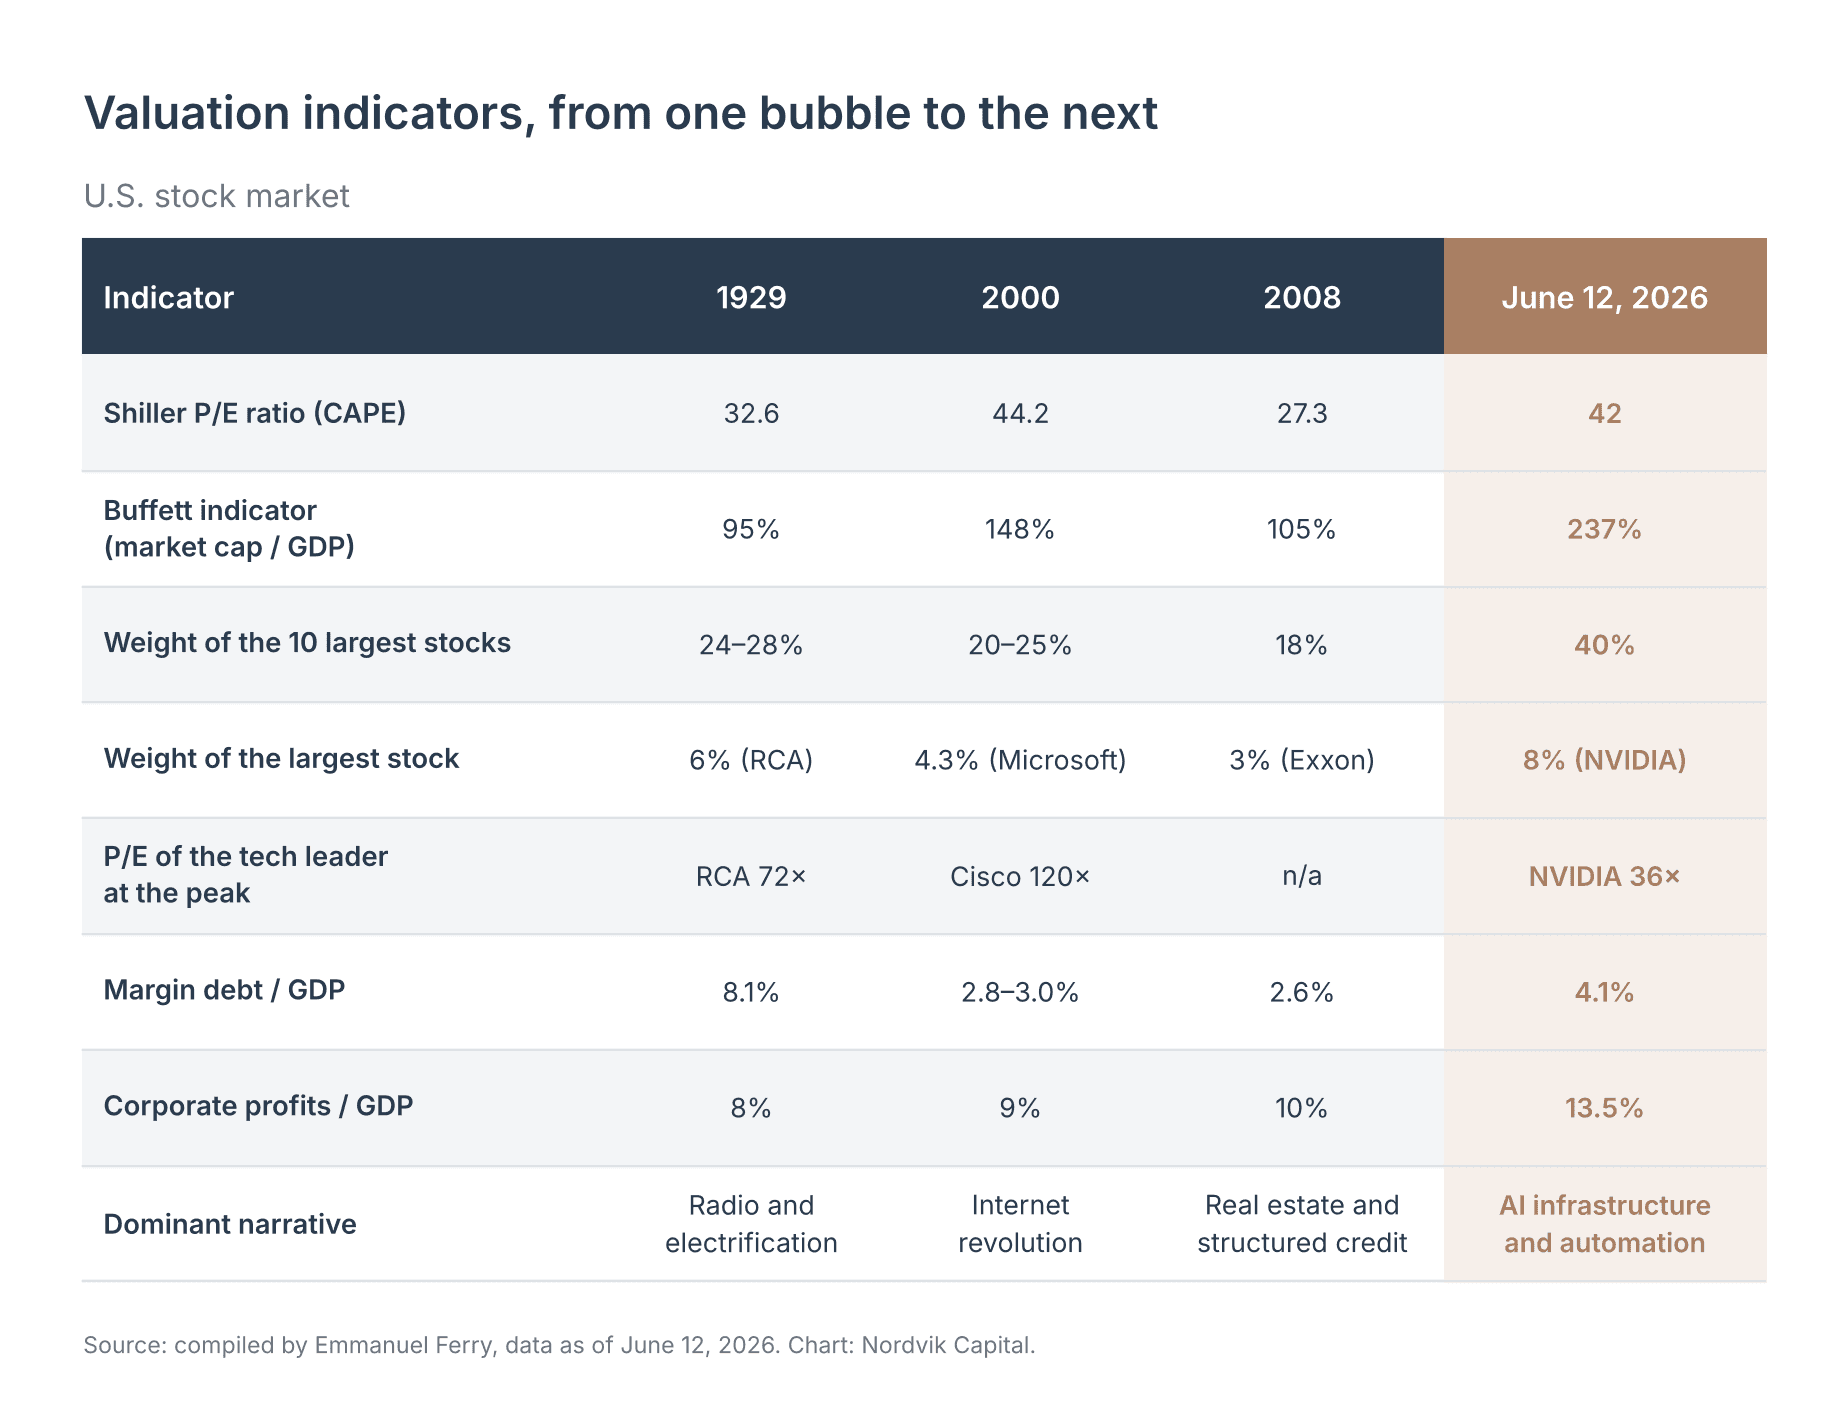
The concentration of the market in a few AI-related companies resembles the peaks of past speculative bubbles, such as the Internet bubble of 2000. According to Bank of America, roughly ten AI-related stocks now account for close to 40% of the value of the U.S. stock market, a level comparable to the great bubbles of the past.

Some indicators, such as the Shiller price-to-earnings ratio (price divided by average earnings over the past 10 years), show a market that is more expensive than in 1929 or 2008, and comparable to 2000.
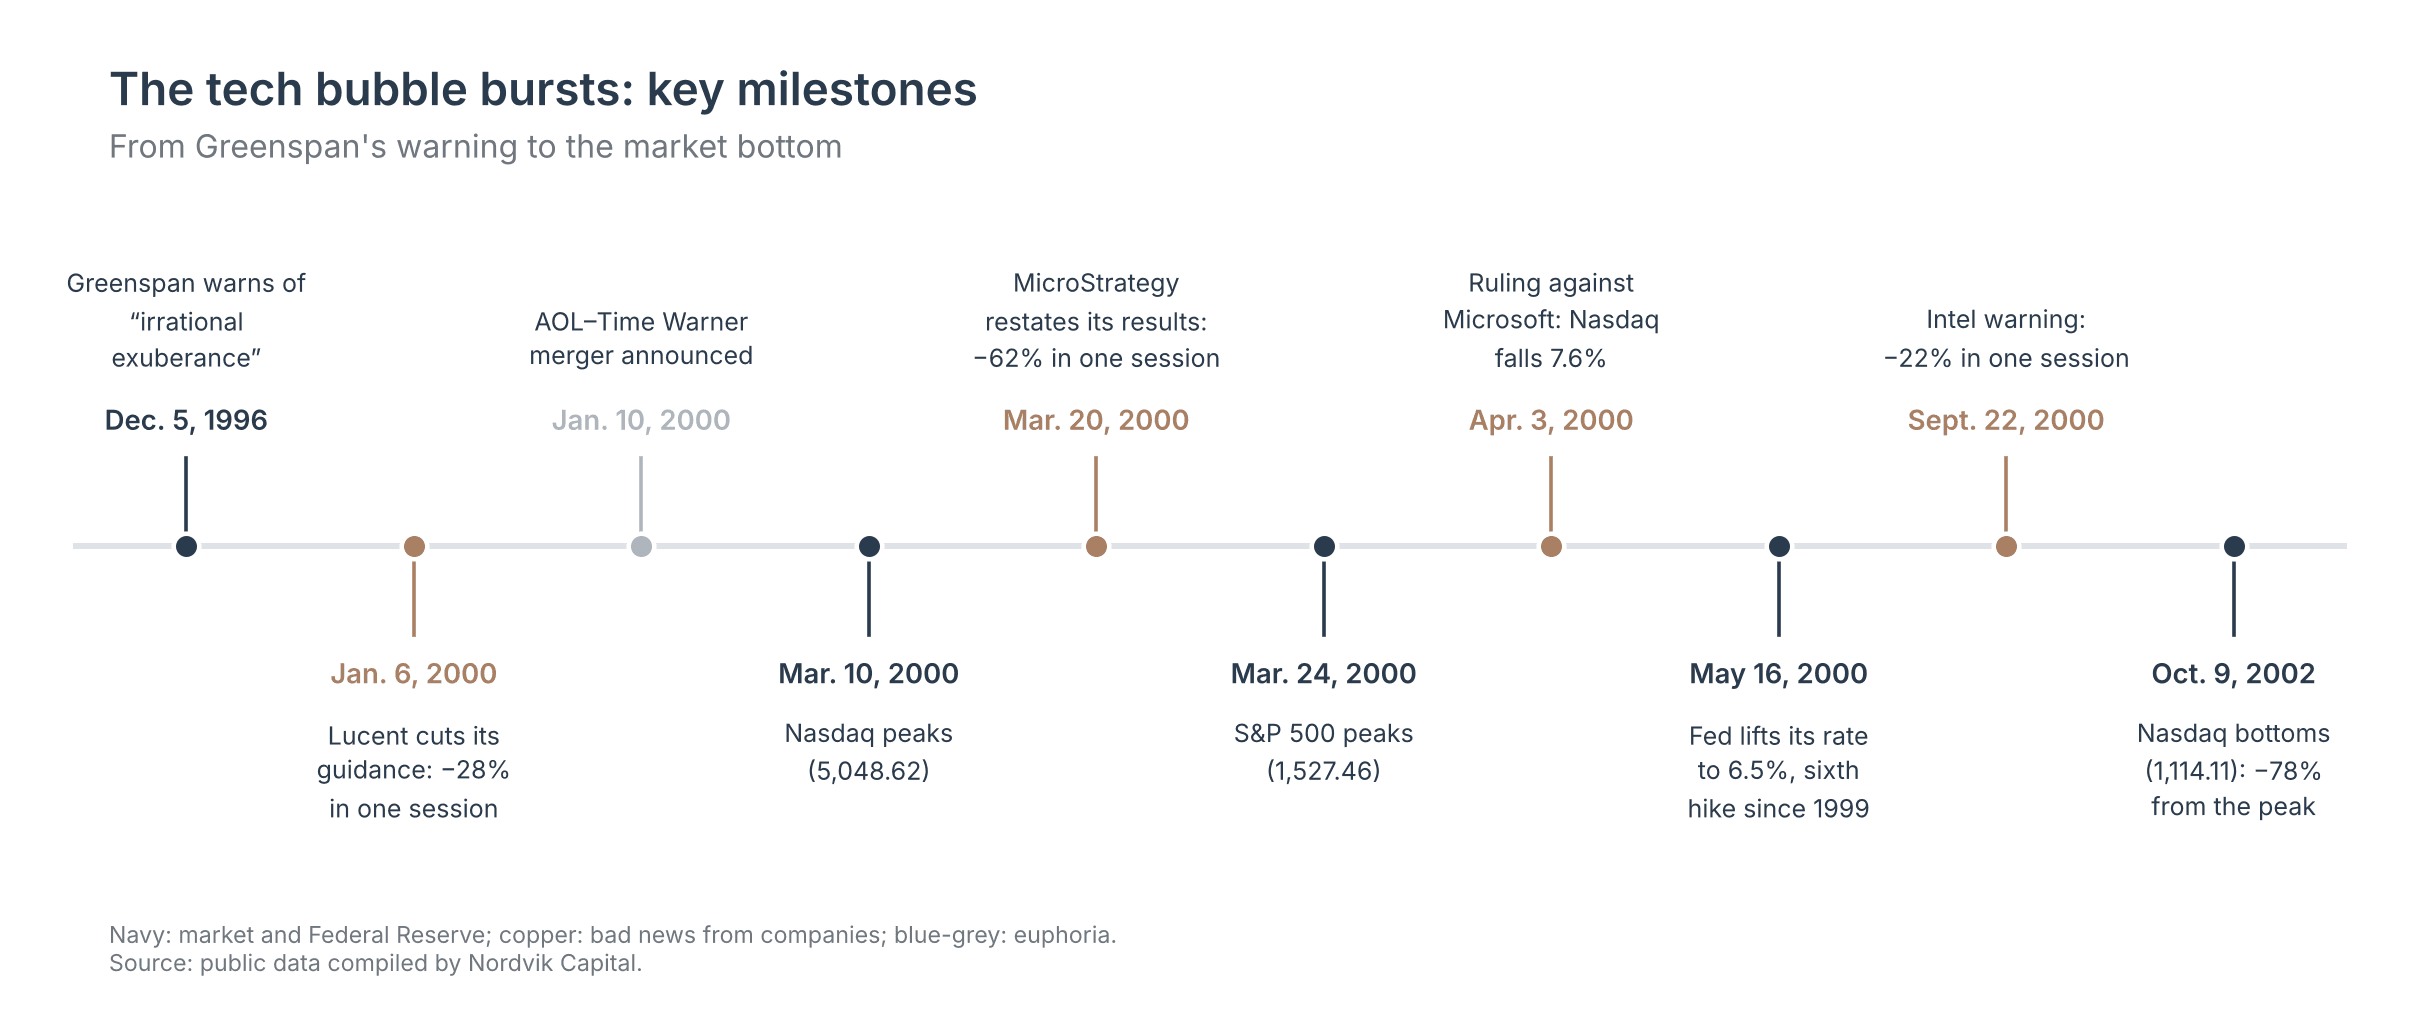
That said, it is very hard to predict when a bubble will burst. Alan Greenspan, then chairman of the U.S. Federal Reserve, spoke of “irrational exuberance” in December 1996. The bubble did not burst until March 2000, more than three years later.
Back then, the first sign of weakness came in January 2000, when Lucent Technologies, a competitor of Nortel, cut its profit forecast. The Federal Reserve then kept raising rates, which deepened the market's decline.
This time, we believe the market top will be marked by one of the large cloud providers (the “hyperscalers,” such as Meta or Microsoft) announcing a cut to its capital spending. On that front, Bloomberg reported this week that Meta was considering selling part of its excess capacity in AI servers. It is one of the first times we have heard the words “excess capacity.”
Even so, there are always opportunities. The Nasdaq peaked on March 10, 2000, and the S&P 500 on March 24. Yet more defensive stocks, out of favour during a bubble, did very well that year. The consumer staples index (companies such as Coca-Cola or Colgate) gained about 40% between early March and the end of 2000¹.

In our view, the current environment offers attractive buying opportunities among the stocks that have been left behind in favour of AI. These companies could well outperform the market if the big technology names were to correct.
We shall see…
François
Notes and sources
¹ Total return of the Consumer Staples Select Sector SPDR ETF (XLP), which tracks the S&P 500 consumer staples index, dividends reinvested, from the end of February to the end of December 2000 (adjusted prices from $10.80 to $15.22, or +41%). Source: Digrin, XLP price history.
Charts: BofA Global Investment Strategy, GFD Finaeon and Bloomberg (concentration); compiled by Emmanuel Ferry, data as of June 12, 2026 (indicators); public data compiled by Nordvik Capital (timeline); Topdown Charts and LSEG (relative valuations). All charts were produced by Nordvik Capital.
This publication reflects Nordvik Capital’s views as of the date of publication. It is provided for informational purposes only and does not constitute personalized financial, tax, or legal advice, nor is it a recommendation to buy or sell any security. Past performance is no guarantee of future returns.
RELATED READING
·
Market Commentary
·
Market Commentary
